R^2 Regression
R^2 Regression
#101daysofcode
It is a measure of how close the data are to the line of best fit given by are regression model.
1(100%) is best score and 0(0%) is the worst score.
Goodness of fit tell how well do, your model has predicted value
In Simple terms it shows how well the data fit the regression model (the goodness of fit).
How to Calculate R-Squared
The formula for calculating R-squared is:
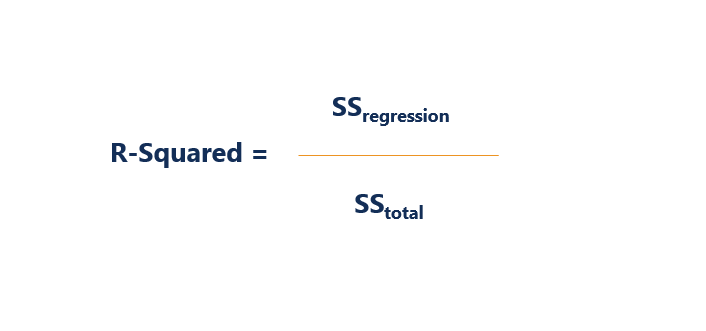
Where:
- SSregression is the sum of squares due to regression (explained sum of squares)
- SStotal is the total sum of squares
Practical
import pandas as pd
from sklearn.model_selection import train_test_split
from sklearn.impute import SimpleImputer
############## DATA CLEANING #####################################################
df=pd.read_csv(r'path')
# Numerical
num_var=df.select_dtypes(include=['int64','float64']).columns
print(df[num_var])
im=SimpleImputer(strategy='mean')
im.fit(df[num_var])
df[num_var]=im.transform(df[num_var])
print(df[num_var].isnull().sum())
# Categorical
cat_var=df.select_dtypes(include='O').columns
imp=SimpleImputer(strategy='most_frequent')
imp.fit(df[cat_var])
df[cat_var]=imp.transform(df[cat_var])
print(df.isnull().sum().sum())
################# DATA PREPROCESSING ###########################################
df2=df.drop(columns=df[cat_var]) Here you should try using different methods of
data preprocessing and please let me know
if you used
# print(df2)
################## DATA SPlITING ################################################
X=df2.drop(columns='price', axis=1)
y=df2['price']
from sklearn.model_selection import train_test_split
X_train, X_test, y_train, y_test=train_test_split(X, y, test_size=0.2, random_state=69)
################## FEATURE SCALING ####################################################
from sklearn.preprocessing import StandardScaler
sc=StandardScaler()
sc.fit(X_train)
X_train=sc.transform(X_train)
X_test=sc.transform(X_test)
################### TRAINING ####################################################
from sklearn.linear_model import LinearRegression
lr=LinearRegression()
lr.fit(X_train, y_train)
# print(lr.coef_) # used to print feature coefeciant that our model has learned
print(lr.intercept_)
################# PREDICTION ###############################################
pre=lr.predict(X_test)
print(pre) # the predicted values
print(y_test) # the original values
score=lr.score(X_test, y_test) # shows you the accuracy percentage of your model
print(score*100)
########### R-square #####################################################
from sklearn.metrics import r2_score
y_pre=lr.predict(X_test)
r2=r2_score(y_test, y_pre)
print(r2)

Comments
Post a Comment